
America Records Over 800 Fatal Work Zone Crashes a Year. Data Reveals the Deadliest States for Drivers.
Key Takeaways
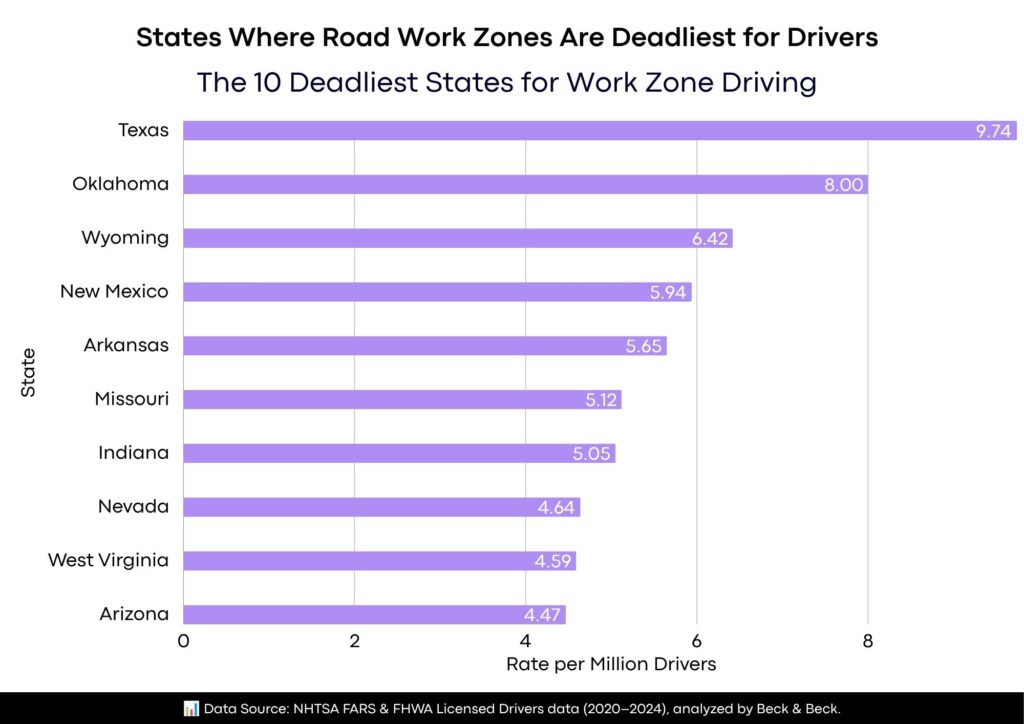
- Deadliest: Texas ranks first with 9.74 fatal work zone crashes per million licensed drivers, followed by Oklahoma (8.00) and Wyoming (6.42). Texas alone accounts for 22.3% of all fatal work zone crashes nationwide despite holding only 8.0% of the nation’s licensed drivers.
- Regional Divide: The South produces 53.8% of all fatal work zone crashes while holding 38.2% of licensed drivers, and 10 of its 16 states exceed the national average. Not a single Northeastern state exceeds the national average.
- Safest: New York records the lowest rate in the country at 0.54 per million, followed by New Hampshire (0.71) and Washington (1.04). Seven of the 10 safest states are in the Northeast.

Every year, millions of American drivers pass through active road construction zones, navigating narrowed lanes and heavy machinery at highway speeds. These corridors are vital to the nation’s infrastructure, yet they create some of the most dangerous conditions on American roads. For most motorists, orange cones are little more than an inconvenience. But the danger they represent is far from uniform. In some parts of the country, driving through a work zone is dramatically more perilous than in others.
According to an analysis by Beck & Beck, which examined NHTSA Fatality Analysis Reporting System data and Federal Highway Administration licensed driver statistics from 2020 through 2024, all 50 states were ranked by average annual fatal work zone crashes per million licensed drivers.
The 10 Deadliest States for Work Zone Driving
| Rank | State | Avg. Annual Fatal Work Zone Crashes | Avg. Annual Licensed Drivers | Rate per Million Drivers |
| 1 | Texas | 182.0 | 18,681,387 | 9.74 |
| 2 | Oklahoma | 20.6 | 2,573,415 | 8.00 |
| 3 | Wyoming | 2.8 | 436,292 | 6.42 |
| 4 | New Mexico | 9.0 | 1,515,219 | 5.94 |
| 5 | Arkansas | 13.6 | 2,408,796 | 5.65 |
| 6 | Missouri | 22.0 | 4,293,462 | 5.12 |
| 7 | Indiana | 23.6 | 4,671,736 | 5.05 |
| 8 | Nevada | 10.2 | 2,196,354 | 4.64 |
| 9 | West Virginia | 5.2 | 1,133,588 | 4.59 |
| 10 | Arizona | 26.0 | 5,814,821 | 4.47 |
Texas alone accounts for 22.3% of all fatal work zone crashes nationally despite holding only 8.0% of licensed drivers, recording a rate 2.8 times the national average of 3.48 per million.
The 10 Safest States for Work Zone Driving
| Rank | State | Avg. Annual Fatal Work Zone Crashes | Avg. Annual Licensed Drivers | Rate per Million Drivers |
| 41 | Mississippi | 3.8 | 2,050,050 | 1.85 |
| 42 | Pennsylvania | 15.0 | 9,079,044 | 1.65 |
| 43 | Connecticut | 4.2 | 2,602,251 | 1.61 |
| 44 | Rhode Island | 1.2 | 755,883 | 1.59 |
| 45 | Hawaii | 1.4 | 935,920 | 1.50 |
| 46 | New Jersey | 8.2 | 6,626,757 | 1.24 |
| 47 | Massachusetts | 5.4 | 4,912,206 | 1.10 |
| 48 | Washington | 6.2 | 5,940,895 | 1.04 |
| 49 | New Hampshire | 0.8 | 1,118,949 | 0.71 |
| 50 | New York | 6.6 | 12,182,333 | 0.54 |
Seven of the 10 safest states are in the Northeast, making it the safest region for work zone driving in the country. New York, the safest state overall, averages just 6.6 fatal work zone crashes per year despite having the fourth-largest licensed driver population (12.2 million) in the nation.
Regional Divide: How Work Zone Risk Varies Across America
| Region | States | Total Avg. Annual Crashes | Weighted Rate per Million Drivers | States Above National Avg. |
| South | 16 | 438.2 | 4.89 | 10 of 16 |
| West | 13 | 184.8 | 3.25 | 5 of 13 |
| Midwest | 12 | 147.0 | 3.00 | 4 of 12 |
| Northeast | 9 | 44.8 | 1.15 | 0 of 9 |
The South produces 53.8% of all fatal work zone crashes while holding 38.2% of the nation’s licensed drivers, and its weighted rate of 4.89 per million exceeds the national average by 41%. The Northeast is the only region where every single state falls below the national average, recording a collective rate of 1.15 per million, roughly one-third the national figure.
Fatal Work Zone Crashes Declined 13% From Their 2021 Peak
| Year | Total Fatal Work Zone Crashes (50 States) | Change From Prior Year |
| 2020 | 779 | N/A |
| 2021 | 878 | +12.7% |
| 2022 | 832 | (-5.2%) |
| 2023 | 822 | (-1.2%) |
| 2024 | 763 | (-7.2%) |
Fatal work zone crashes peaked at 878 in 2021 before declining 13.1% to 763 in 2024, though totals remain above 750 in every year studied. Seven states recorded zero fatal work zone crashes in 2024, and New Hampshire recorded zero in three of the five years analyzed (2022, 2023, and 2024).
Methodology
This analysis examined fatal motor vehicle crashes occurring within active road construction and maintenance zones across all 50 U.S. states from 2020 through 2024. Fatal crash data was sourced from the National Highway Traffic Safety Administration’s (NHTSA) Fatality Analysis Reporting System (FARS), a nationwide census of all motor vehicle crashes on public roads resulting in at least one fatality within 30 days, filtered to crashes coded as occurring within an active work zone. For each state, the five-year average annual number of fatal work zone crashes was divided by the five-year average annual number of licensed drivers and multiplied by one million to produce the primary metric: average annual fatal work zone crashes per million licensed drivers. States were ranked from the highest to lowest rate, with rank 1 assigned to the state with the greatest per-capita risk.
Data Sources
NHTSA Fatality Analysis Reporting System (FARS): https://cdan.dot.gov/query
Federal Highway Administration, Highway Statistics, Licensed Drivers (Table DL-1C): https://www.fhwa.dot.gov/policyinformation/statistics/2024/dl1c.cfm
Research Dataset: https://docs.google.com/spreadsheets/d/10E_48SY1RJkViyHdgXb4LkFzSK6YmOsJoO2bXkvpaFk/edit?gid=0#gid=0
Study by: https://becklawmo.com/
About Beck & Beck
Beck & Beck is a Missouri-based personal injury law firm representing individuals injured in automobile and motorcycle crashes. The firm handles vehicle accident claims, insurance negotiations, medical care coordination, and accident litigation, with a commitment to promoting road safety through data-driven research.
The post America Records Over 800 Fatal Work Zone Crashes a Year. Data Reveals the Deadliest States for Drivers. appeared first on BNO News.
Ella Rae Greene, Editor In Chief