
Interactive ‘ICE Detention Map’ shows 71% of detainees have no criminal record
NEW YORK — Five years ago, Congress required U.S. Immigration and Customs Enforcement to begin publishing detailed statistics on its detainees every two weeks. The data, contained in a downloadable spreadsheet at the bottom of the “Detention Management” page on ICE’s website, details everything from the facilities where immigrants are held to the lengths of their detainment.
Of all the statistics in the spreadsheet, this may be the most telling: Of the 46,113 individuals detained by ICE, 71% have no criminal record.
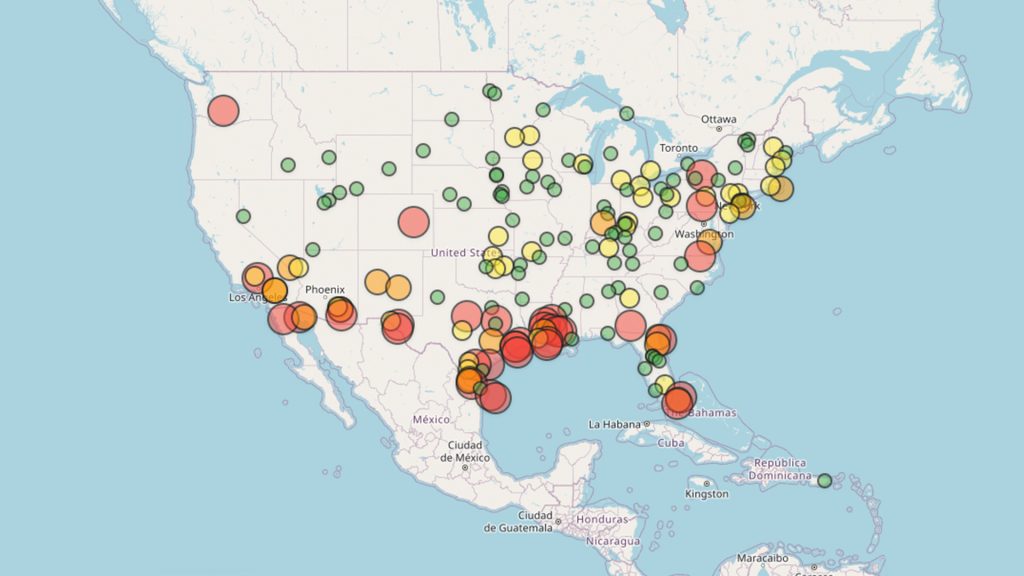
That finding was highlighted Friday at the Hackers on Planet Earth conference in Queens, New York, where the privacy organization Lockdown Systems unveiled a new tool that visualizes all of ICE’s data on an interactive map of the country.
Known as the “ICE Detention Map,” the tool — available at watchice.org — allows anyone to see not only where immigrants are being held but the ratio of criminals to non-criminals.
The data challenges President Donald Trump’s claim that “murderers, human traffickers, gang members, and other criminals” are the focus of his mass-deportation policies, Jennifer Helsby, the engineer and researcher who built the tool, told Straight Arrow News.
Simplifying complex data
Lockdown Systems says the map “visualizes public data that ICE is legally required to publish, and automatically keeps itself up-to-date.”
“If you’re in the United States,” the organization adds, “you can use it to see where your local ICE detention facilities are, how many people are being locked up there, and how many of them don’t have criminal records.”
The idea for the map arose after Helsby and other members of Lockdown Systems came across an Instagram video about ICE’s spreadsheet from Gustavo Solis, an investigative reporter who covers the border and immigration.
Given the complexity of the data, Lockdown Systems sought to make it more accessible.
The organization, which maintains numerous privacy and security related tools, developed a program that automatically checks ICE’s spreadsheet for updates. If new information is detected, the ICE Detention Map is updated as well.
Markers on the map vary in size and color based on the number of people held at specific facilities.
A privately run detention facility in Tacoma, Washington, for example, is tagged with a large red circle indicating it was holding 1,137 detainees. Of those, 39%, or 443 people, had criminal records.
ICE also assigns a threat level ranking to each detainee. Those under threat level 1 may have aggravated felonies, a history of violence, ties to terrorism or may be deemed a threat to national security.
Level 2 includes those with less serious criminal histories involving issues such as fraud and weapons possession. Level 3 encompasses detainees with one or two non-violent misdemeanors, while those with no assigned ICE threat level have no criminal convictions.
A correctional center in Louisiana, for example, was last reported to be holding 921 detainees. The data shows 84 people, or 9%, had criminal convictions. The other 853 detainees had no ICE threat level.
Limitations to data
The detention map’s data has its limitations. Lockdown Systems says it hopes to integrate archived data to let users view ICE detention statistics dating back to January 2021.
In addition, Micah Lee, a journalist and security engineer with Lockdown Systems, said that while the map shows formal detentions by ICE in the United States, “ICE arrests, deportations, or renditions to foreign gulags” are not included.
“Presumably, when ICE deports someone, the number of people in detention goes down,” Lee told SAN. “So really, the map shows a snapshot of people held by ICE at a given time, which doesn’t fully capture the horrors of Trump’s mass deportation program.”